Writing code's easy, but debugging's a nightmare. You write some React code, it crashes in the browser, and you spend the next three hours console-logging variables like a detective in a bad movie. But OpenAI recently released OpenAI Codex Developer Mode directly in Google Chrome. This new mode lets Codex connect straight to your browser tabs so it can inspect the DOM and fix issues in real time. If you're a freelance developer in Bengaluru or a student building a startup on a college budget, this'll change how you work.
I tried it last week on a small GST calculator app I was building. The tool went way beyond code fixes. It clicked buttons. It opened the browser, clicked around, found where the state went wrong, and updated my source code. It's like having a junior developer sitting next to you. But this one doesn't drink all your coffee or argue about tabs versus spaces. Chrome is quickly becoming the primary playground for AI coding assistants in 2026, if you ask me.
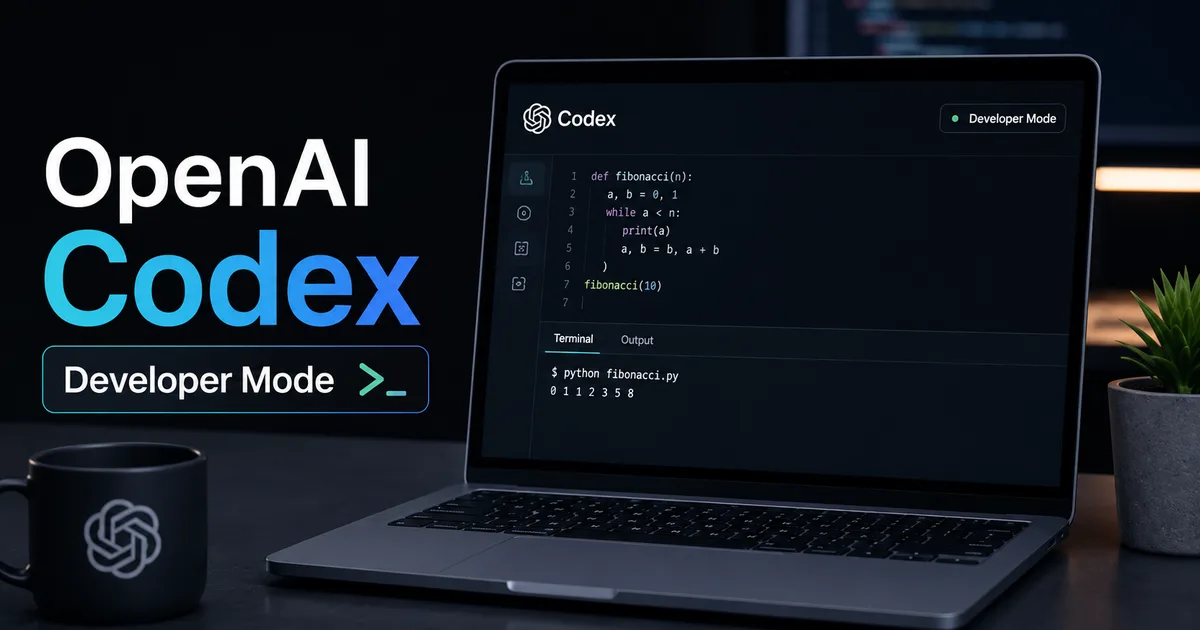
What is OpenAI Codex developer mode for AI debugging?
Look, the basic idea's simple. You don't have to run Codex in a separate window and copy code back and forth. Instead, you run the Codex app as a background controller. The integration's using the Chrome DevTools Protocol. This connects your local environment directly to the active browser window. So Codex can inspect HTML elements and read console errors as they happen. In my experience, it works pretty smoothly.
Neowin reported that OpenAI's making Codex more useful in Chrome and the cloud. That explains why they've built this deep integration. By using the browser's own debugging API, Codex sees exactly what you see. It's that simple.
"By integrating directly with DevTools, AI agents can inspect runtime errors and interact with page elements without manual copy-paste workflows." - StartupHub.ai
For Indian freelancers charging clients in USD or INR, speed's money. If you can fix a broken payment form or a misaligned CSS grid in two minutes instead of twenty, your rate goes up. Also, because it runs locally or connects to your cloud workspace, you don't have to upload your entire database structure to some external server. Honestly, it's a massive win for privacy-conscious developers.
OpenAI also added a floating task overlay called Codex Pets in this update, as reported by Let's Data Science. These are interactive agents. They float on your desktop and tell you what Codex's currently doing. Honestly, they're a bit of a gimmick (which is kind of cute, I guess). But they do make the debugging process feel less lonely when you're writing code at 2 AM.
How to configure the Chrome DevTools protocol link
Setting this up isn't as scary as it sounds. Seriously. You don't need to be a systems engineer to get it running.
First, make sure you've got the correct version. OpenAI launched the Codex app for Windows recently, as documented by IT Voice Media. So you no longer need a macOS machine to use it. That's a relief.
Connecting Codex to your browser takes just a few steps:
- Launch Chrome with remote debugging enabled. You just run your Chrome executable from the terminal with the remote-debugging-port flag set to 9222.
- Open your Codex application. Then select the local browser integration option from the settings menu.
- Provide the port number and click connect. There's a small green status indicator that shows Codex's connected to Chrome.
- Select the tab you want to debug. Codex'll pull the DOM structure and display it in its sidebar.
Once connected, Codex uses the protocol to listen for exceptions. When a JavaScript error occurs, Codex automatically highlights the offending line in your source file. It's a much cleaner workflow. You don't have to constantly check the console tab in DevTools.
For small businesses in India running e-commerce sites, this local testing's very useful. In my experience, you can test UPI payment redirect flows or Aadhaar verification integrations without mock servers. Just run the app locally and trigger the protocol. Then Codex will analyze the network responses.
Of course, you've still got to pay attention. Sometimes Codex gets confused. Especially if your DOM's too complex. But it usually gets the job done.
Analyzing appshots and goal mode for complex tasks
One of the biggest additions in the recent update's Goal mode, which Digit.in covered in detail. When you activate it, you don't just ask Codex to fix a single bug. Instead, you give it a high-level goal, like 'fix the form validation on the signup page and ensure the OTP button disable state works.' Honestly, it's pretty powerful.
Codex'll then plan a sequence of steps, run them, inspect the results via Chrome, and self-correct if it fails. Basically, it uses a feedback loop.
To make this work, Codex relies on Appshots. This feature captures visual snapshots of your app's state at each step. By comparing these Appshots, the model can tell if a modal popped up. It can also tell if a button changed color.
VentureBeat noted that this update lets agents build interactive enterprise workspaces via Sites and plugins. So you can build entire internal dashboards and let Codex deploy them locally. The Sites feature competes directly with platforms like Lovable and Replit. It lets Codex compile and host temporary preview links.
If you're a student preparing for engineering exams or building a portfolio, this means you can build complex web projects in a fraction of the time. You don't need a paid server. Just run the entire workflow on your local machine. In my experience, it's much faster.
Comparing Codex developer mode with other AI tools
We should compare this with other popular coding assistants available in India. GitHub Copilot's great for inline autocompletion, but it lacks direct browser integration. Claude's excellent at general reasoning. But you've to copy and paste code manually.
| Tool | Browser Integration | Pricing (INR / Free Tier) | Best Use Case |
|---|---|---|---|
| OpenAI Codex Developer Mode | Full integration via Chrome DevTools Protocol | Free tier with banked resets, paid plans start around ₹1,600/month | Interactive UI debugging and live testing |
| GitHub Copilot | None (IDE only) | Free for students, ₹830/month for professionals | Writing boilerplate and quick helper functions |
| Claude (Anthropic) | Limited browser extensions | Free tier, Pro starts around ₹1,800/month | Refactoring complex logic and architectural discussions |
The pricing's a big factor for Indian developers. Paying ₹1,600 a month for Codex might seem steep for a college student. But the free tier's surprisingly generous, if you ask me.
Speaking of Anthropic, YourStory.com reported that they've recently acquired a dev tools startup that OpenAI's using. This shows how intense the competition's becoming in the web debugging space. We'll probably see Anthropic launch a similar browser tool soon. That's good news for developers who want choices.
Understanding the free banked reset system and Indian pricing
OpenAI recently introduced a free banked reset system for Codex users, which Crypto Briefing covered. If you're on the free tier, you get a daily token quota. But if you don't use all your tokens, they don't just vanish at midnight. Instead, a portion of those unused tokens's banked. This means you can save them up for larger debugging sessions later in the week.
For Indian freelancers who don't code every day, this's incredibly helpful. You might spend Monday and Tuesday designing layouts. Then you do all your heavy coding and debugging on Wednesday. The banked resets ensure you don't run out of tokens right when you're in the middle of fixing a tough bug.
If you do exceed the free tier, the paid plans are billed in USD. This'll convert to around ₹1,600 to ₹2,000 per month depending on the exchange rate. You can pay using standard Indian credit cards or UPI-linked international cards. Honestly, if you're working on commercial projects, the time saved makes this expense easy to justify.
We should also mention local regulations. If you're handling sensitive user data, like Aadhaar numbers or bank details, you've got to comply with the Digital Personal Data Protection (DPDP) Act of 2023. Running Codex locally via the DevTools protocol's much safer than using cloud-only tools. The data stays on your machine during local debugging. So you're less likely to run into compliance issues with Indian regulators.
Real limitations and bugs you should expect
Let's be honest here. No AI tool's perfect. And Codex Developer Mode's got its share of quirks.
Sometimes the browser integration lags. This is especially true when you've too many tabs open or run a heavy Node.js server in the background. The DevTools protocol connection can drop without warning. That forces you to restart Chrome with the debugging flag.
Another issue's with complex single-page apps. If your app relies on heavy state libraries like Redux and's got deeply nested components, Codex can get confused. It won't know where the state changes start. It might suggest a CSS fix when the real problem's a broken API call.
Even with these bugs, the tool's a solid step forward. StartupHub.ai reported that Codex enhances web debugging with browser integration, which makes sense. And my experience confirms that. It won't replace manual testing entirely. But it handles the boring parts of debugging so you can focus on building features.
If you want to read more about how AI's changing development workflows, check out our section on AI explainers. Or browse the latest updates in our tech news archive. Also, you'll find other coding utilities in our AI tools guides.