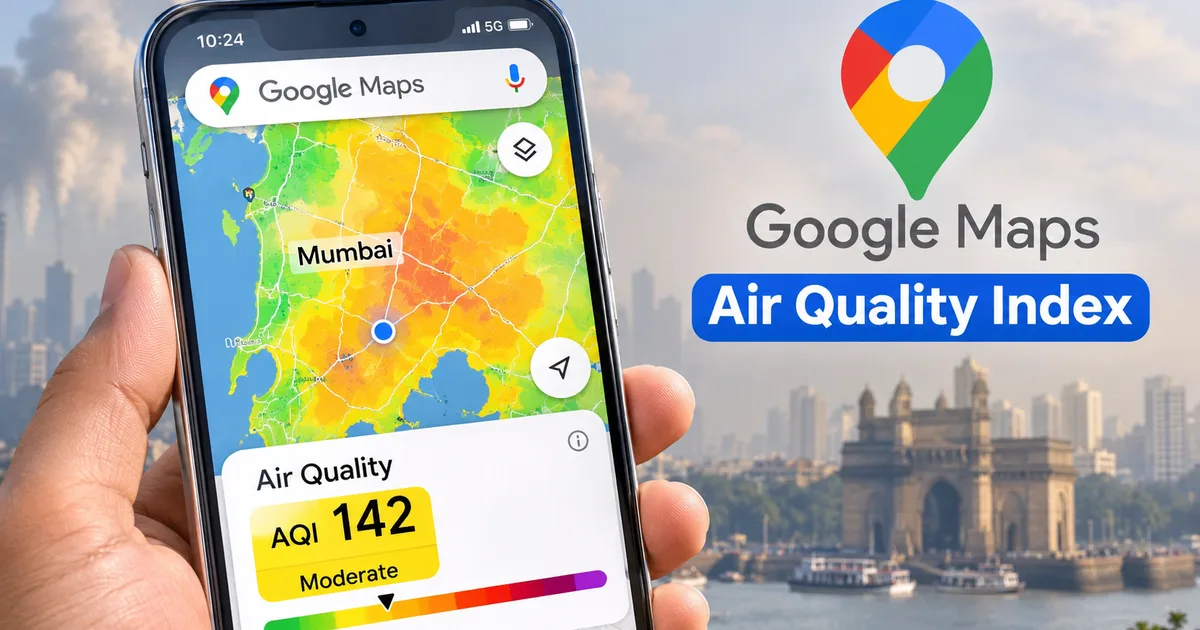
Every winter across northern and central India, the morning haze smells like burnt stubble and car exhaust. If you live in Delhi, Noida, Gurugram, or Kolkata, you already know that scratchy throat feeling by November. That's why the Google Maps Air Quality Index rollout in India came at the right time. Instead of downloading another third-party utility, you can now see live pollution numbers right on the map you already use for daily navigation.
I check it every single morning before stepping out. Just a habit now. Honestly, it's one of the most useful features they've added in years, at least in my experience.
You don't need a fancy phone or any paid subscription. Works fine on a budget Android or an iPhone. The tool is right inside the regular Google Maps app, and it pulls hourly updates for hundreds of Indian towns and neighborhoods. Here's the thing. Pollution levels shift fast depending on morning traffic, factory smoke, and wind speed (the numbers here are a bit fuzzy between junctions anyway). Checking the map takes ten seconds flat. And honestly, it saves your lungs from a lot of punishment.
How to check live AQI on Google Maps app step by step
Google rolled out these air pollution layers across 40 countries, including the United States, Australia, Singapore, and India. It makes checking local air as straightforward as checking traffic before your commute. If you like practical mobile tips, our hands-on tech guides cover plenty of everyday features just like this one. In my experience, most people don't even know the toggle is right there on their screen.
Follow these steps on your phone:
- Update the Google Maps app from the Google Play Store or Apple App Store to ensure you have the newest build. If your app is outdated, the air quality button won't show up at all.
- Open Google Maps on your phone. You'll see your typical blue GPS location dot showing your neighborhood or street.
- Look at the top right corner, right below the search bar. Tap the circular Layers icon, which looks like two stacked squares resting on top of each other.
- A bottom sheet menu will slide up on your screen, presenting map types like Default, Satellite, and Terrain, followed by map details. Tap the Air Quality button located under the Explore or Map details row. It has a green and yellow leaf-style icon.
- Close the layer selection sheet by tapping the small X icon or swiping down. Your main map view will now transform into an interactive color overlay dotted with circular numbers indicating local AQI readings.
- Zoom into your neighborhood to see hyperlocal sensor stations, or drag the map across cities to check conditions in places like Mumbai, Lucknow, or Bengaluru. You can also tap directly on any colored pin to open an information card showing health advice and when the reading was last recorded.
It gets second nature fast. (Annoying to tap through menus, I know, but you can turn it right back off by hitting the default layer again.)
Understanding the Indian AQI color scale on Google Maps
Raw numbers mean nothing without context. What does 180 mean compared to 420? Not much unless you know the scale. In India, the Central Pollution Control Board sets the standard National Air Quality Index across six color bands from 0 to 500. Google Maps sticks to these exact brackets. So you don't have to guess what the numbers mean before heading out for a morning jog. If you ask me, that clarity is what makes it actually usable.
Here's how the color-coded categories work on the map:
- From 0 to 50 is Good, shown in dark green. Air quality is clean and poses little or no risk to anyone, though you rarely see this in major northern metros during winter.
- From 51 to 100 is Satisfactory, displayed in light green. Sensitive individuals might experience minor breathing discomfort, but outdoor activity remains fine for most people.
- From 101 to 200 is Moderate, represented by yellow. People with lung conditions, asthma, or heart issues should limit prolonged outdoor exertion.
- From 201 to 300 is Poor, highlighted in orange. Everyone begins to feel the irritation, and children or elderly relatives should stay indoors during peak hours.
- From 301 to 400 is Very Poor, marked in red. Prolonged exposure causes respiratory illness even in healthy individuals.
- From 401 to 500 is Severe, shown in dark purple or maroon. This is an environmental emergency where physical activity outdoors should be avoided entirely.
According to data tracked during peak winter spikes, Delhi recorded an Air Quality Index of 435, placing several neighborhoods in the severe danger zone where even healthy adults experience breathing difficulty.
When the map turns purple or dark maroon, going out for a brisk walk hurts more than skipping exercise entirely. You're just inhaling toxic air at that point.
Simple as that.
Why the live AQI reading on Google Maps differs from other apps
Say you open Google Maps and spot an AQI of 280 near Connaught Place. Then you check AQI.in or SAFAR and it says 325. Why the gap? People assume one of them is broken or fake. But the difference is purely technical.
First off, reporting frequency is huge. Google Maps pulls hourly updates from regional monitoring stations. Other apps might rely on a rolling 24-hour average, or they might read cheap laser sensors every ten minutes. If a sudden gust of wind blows through in the afternoon, it can scatter smoke for half an hour. That drops the instant sensor reading fast, but the 24-hour average stays stubbornly high.
Second, where the sensor sits makes a massive difference. A monitoring station set up inside a leafy college campus is going to record much lower numbers than one stuck right beside the Anand Vihar bus terminal. Both are accurate for their own spots. A 2026 study in Nature analyzed machine learning models for Kolkata air quality prediction and showed that PM2.5 particles and PM10 levels drive almost all the index swings. When traffic backs up or dust blows across a flyover, readings right there spike immediately. Meanwhile, a quiet neighborhood just a kilometer away stays noticeably cleaner. (I'm not sure exactly why some apps place their hardware so close to bus stands, but location is everything here.)
And third, lots of consumer gadgets calculate scores using their own formulas (which makes sense, actually, given how different their hardware is). If you track wearable tech, check out our Google Fitbit Air India launch updates to see how modern watches handle air tracking alongside fitness stats. But for daily commutes and planning trips, Google Maps gives you a solid, standardized baseline without making you buy extra gear.
To get into the math behind algorithmic forecasts and live mapping systems, take a look at our in-depth tech explainers. We break down the complicated technical stuff into plain English so anyone can follow along.
Practical steps to protect yourself when the AQI turns red
Knowing the air is bad is only half the problem. What do you actually do about it? You can't just stop going to work or keep kids home from school forever. But you can change a few habits once you have real numbers in front of you.
Start with masks. Basic cloth handkerchiefs and surgical masks don't filter out the tiny particles that get trapped in your lungs. They just don't work. Certified N95 respirators cost around ₹30 to ₹60 each at local chemists, and in my experience, they make a massive difference if you commute on a bike or in an auto along dusty main roads.
Look at your indoor air, too. A decent home HEPA air purifier is going to cost between ₹8,000 and ₹18,000, but keeping your windows shut tight during evening smog peaks costs nothing. Also, if you run the AC in your car, switch the vent setting from fresh air to internal circulation. That keeps nasty exhaust fumes out of the cabin while you're stuck in bumper-to-bumper traffic.
And you can always use voice commands while driving so you aren't messing with your phone. If you want hands-free setup on Android, check our Google Gemini Live voice conversations guide to learn how to get updates on the move.
Look, air pollution across Indian cities is a messy problem with no quick fix. Still, having accurate, local data right on your default navigation app takes the guesswork out of your day. Check the map before you leave the house. Keep a couple of masks in your bag when the purple haze rolls in. It won't clean the sky, but it keeps you a whole lot safer.